QGIS Tutorial Part 1: Getting Started with Open Source GIS
Welcome to the first part of our comprehensive QGIS tutorial series! Whether you’re a student, researcher, or professional looking to explore geographic information systems, this guide will help you take your first steps with QGIS, the world’s leading open-source GIS software.
What is QGIS?
QGIS (Quantum GIS) is a free, open-source Geographic Information System that allows you to create, edit, visualize, analyze, and publish geospatial data. Used by governments, universities, and organizations worldwide, QGIS rivals expensive commercial alternatives like ArcGIS while remaining completely free.
Key advantages of QGIS include: - Zero cost - completely free to download and use - Cross-platform - runs on Windows, macOS, and Linux - Active community - extensive documentation and plugin ecosystem - Professional features - cartographic tools, spatial analysis, and data processing - Regular updates - new versions released frequently with improvements
Installation Guide
Getting QGIS up and running takes just a few minutes.
Download QGIS
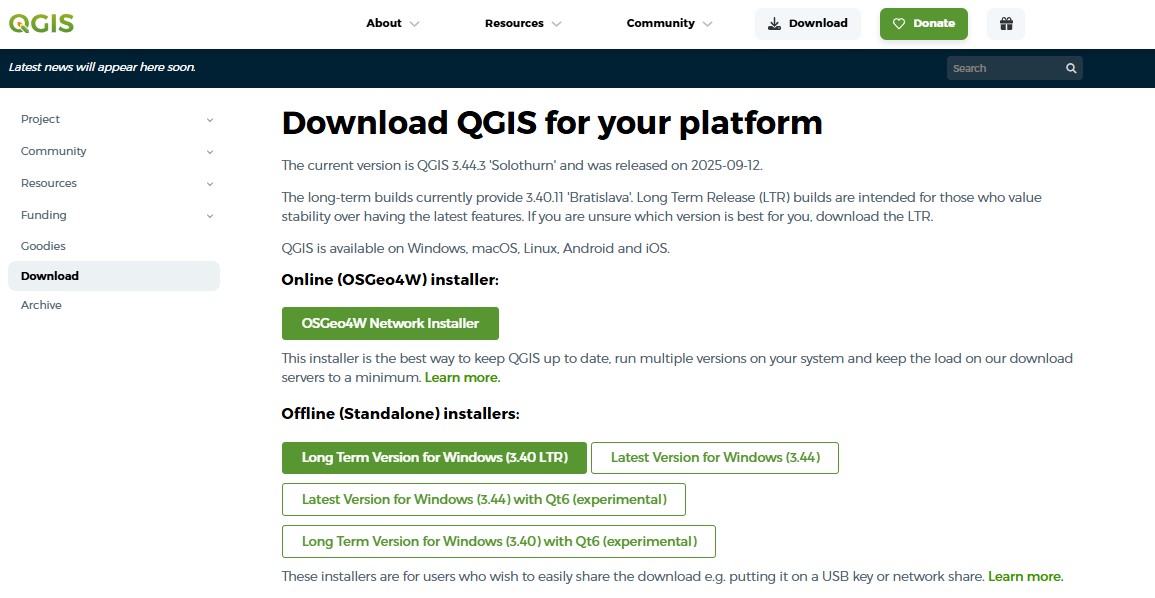
Visit the official QGIS website at qgis.org and navigate to the download section. You’ll see two main versions:
- Long Term Release (LTR) - stable version recommended for production environments
- Latest Release - newest features but may have occasional bugs
For beginners, we recommend the Long Term Release for stability.
Installation Steps
Windows: 1. Download the standalone installer (.exe file) 2. Run the installer with administrator privileges 3. Follow the installation wizard (default settings work fine) 4. Launch QGIS from the Start menu
macOS: 1. Download the .dmg installer 2. Open the downloaded file and drag QGIS to Applications 3. You may need to allow the app in System Preferences > Security
Linux:
Most distributions offer QGIS through package managers
Ubuntu/Debian:
sudo apt install qgis qgis-plugin-grassFedora:
sudo dnf install qgis python3-qgis
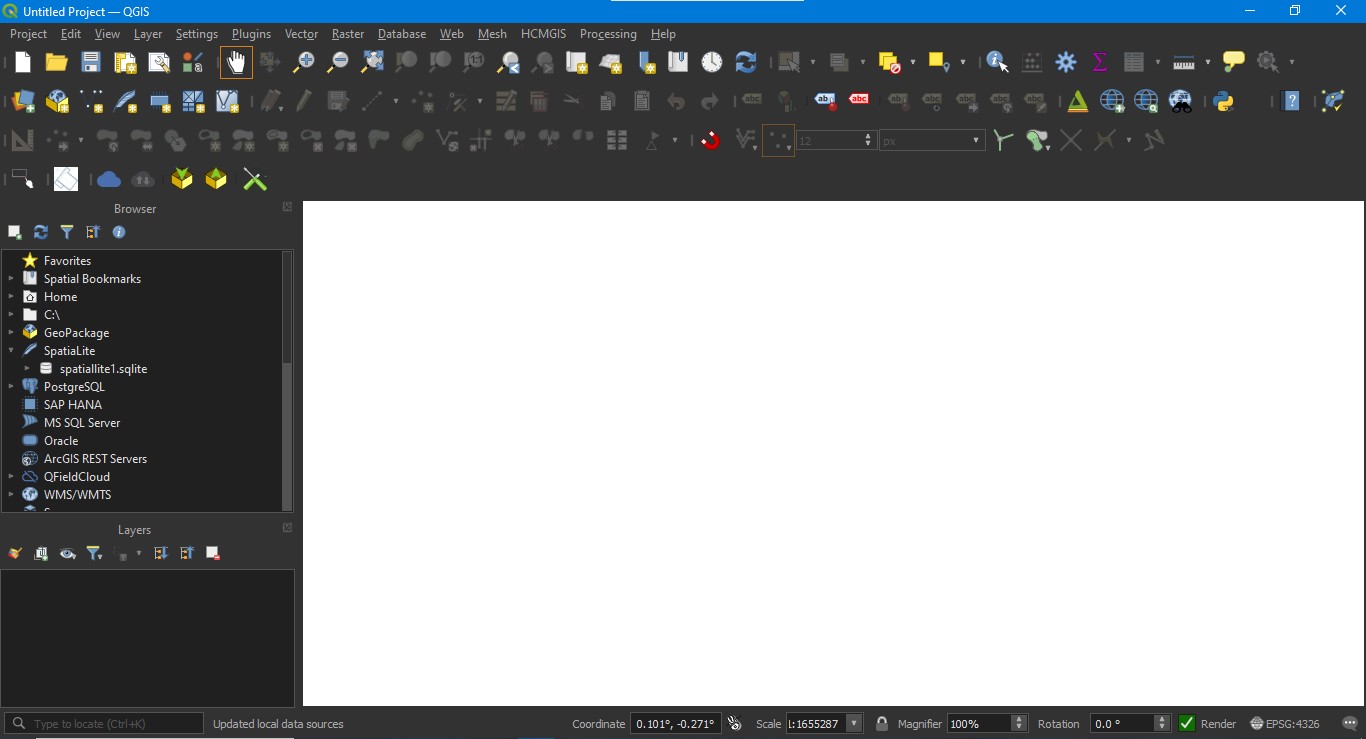
When you first launch QGIS, you might see a tip of the day - these are helpful! The main interface will appear with a blank map canvas ready for your first project.
Understanding the QGIS Interface
The QGIS interface is organized into several key areas that you’ll use constantly.
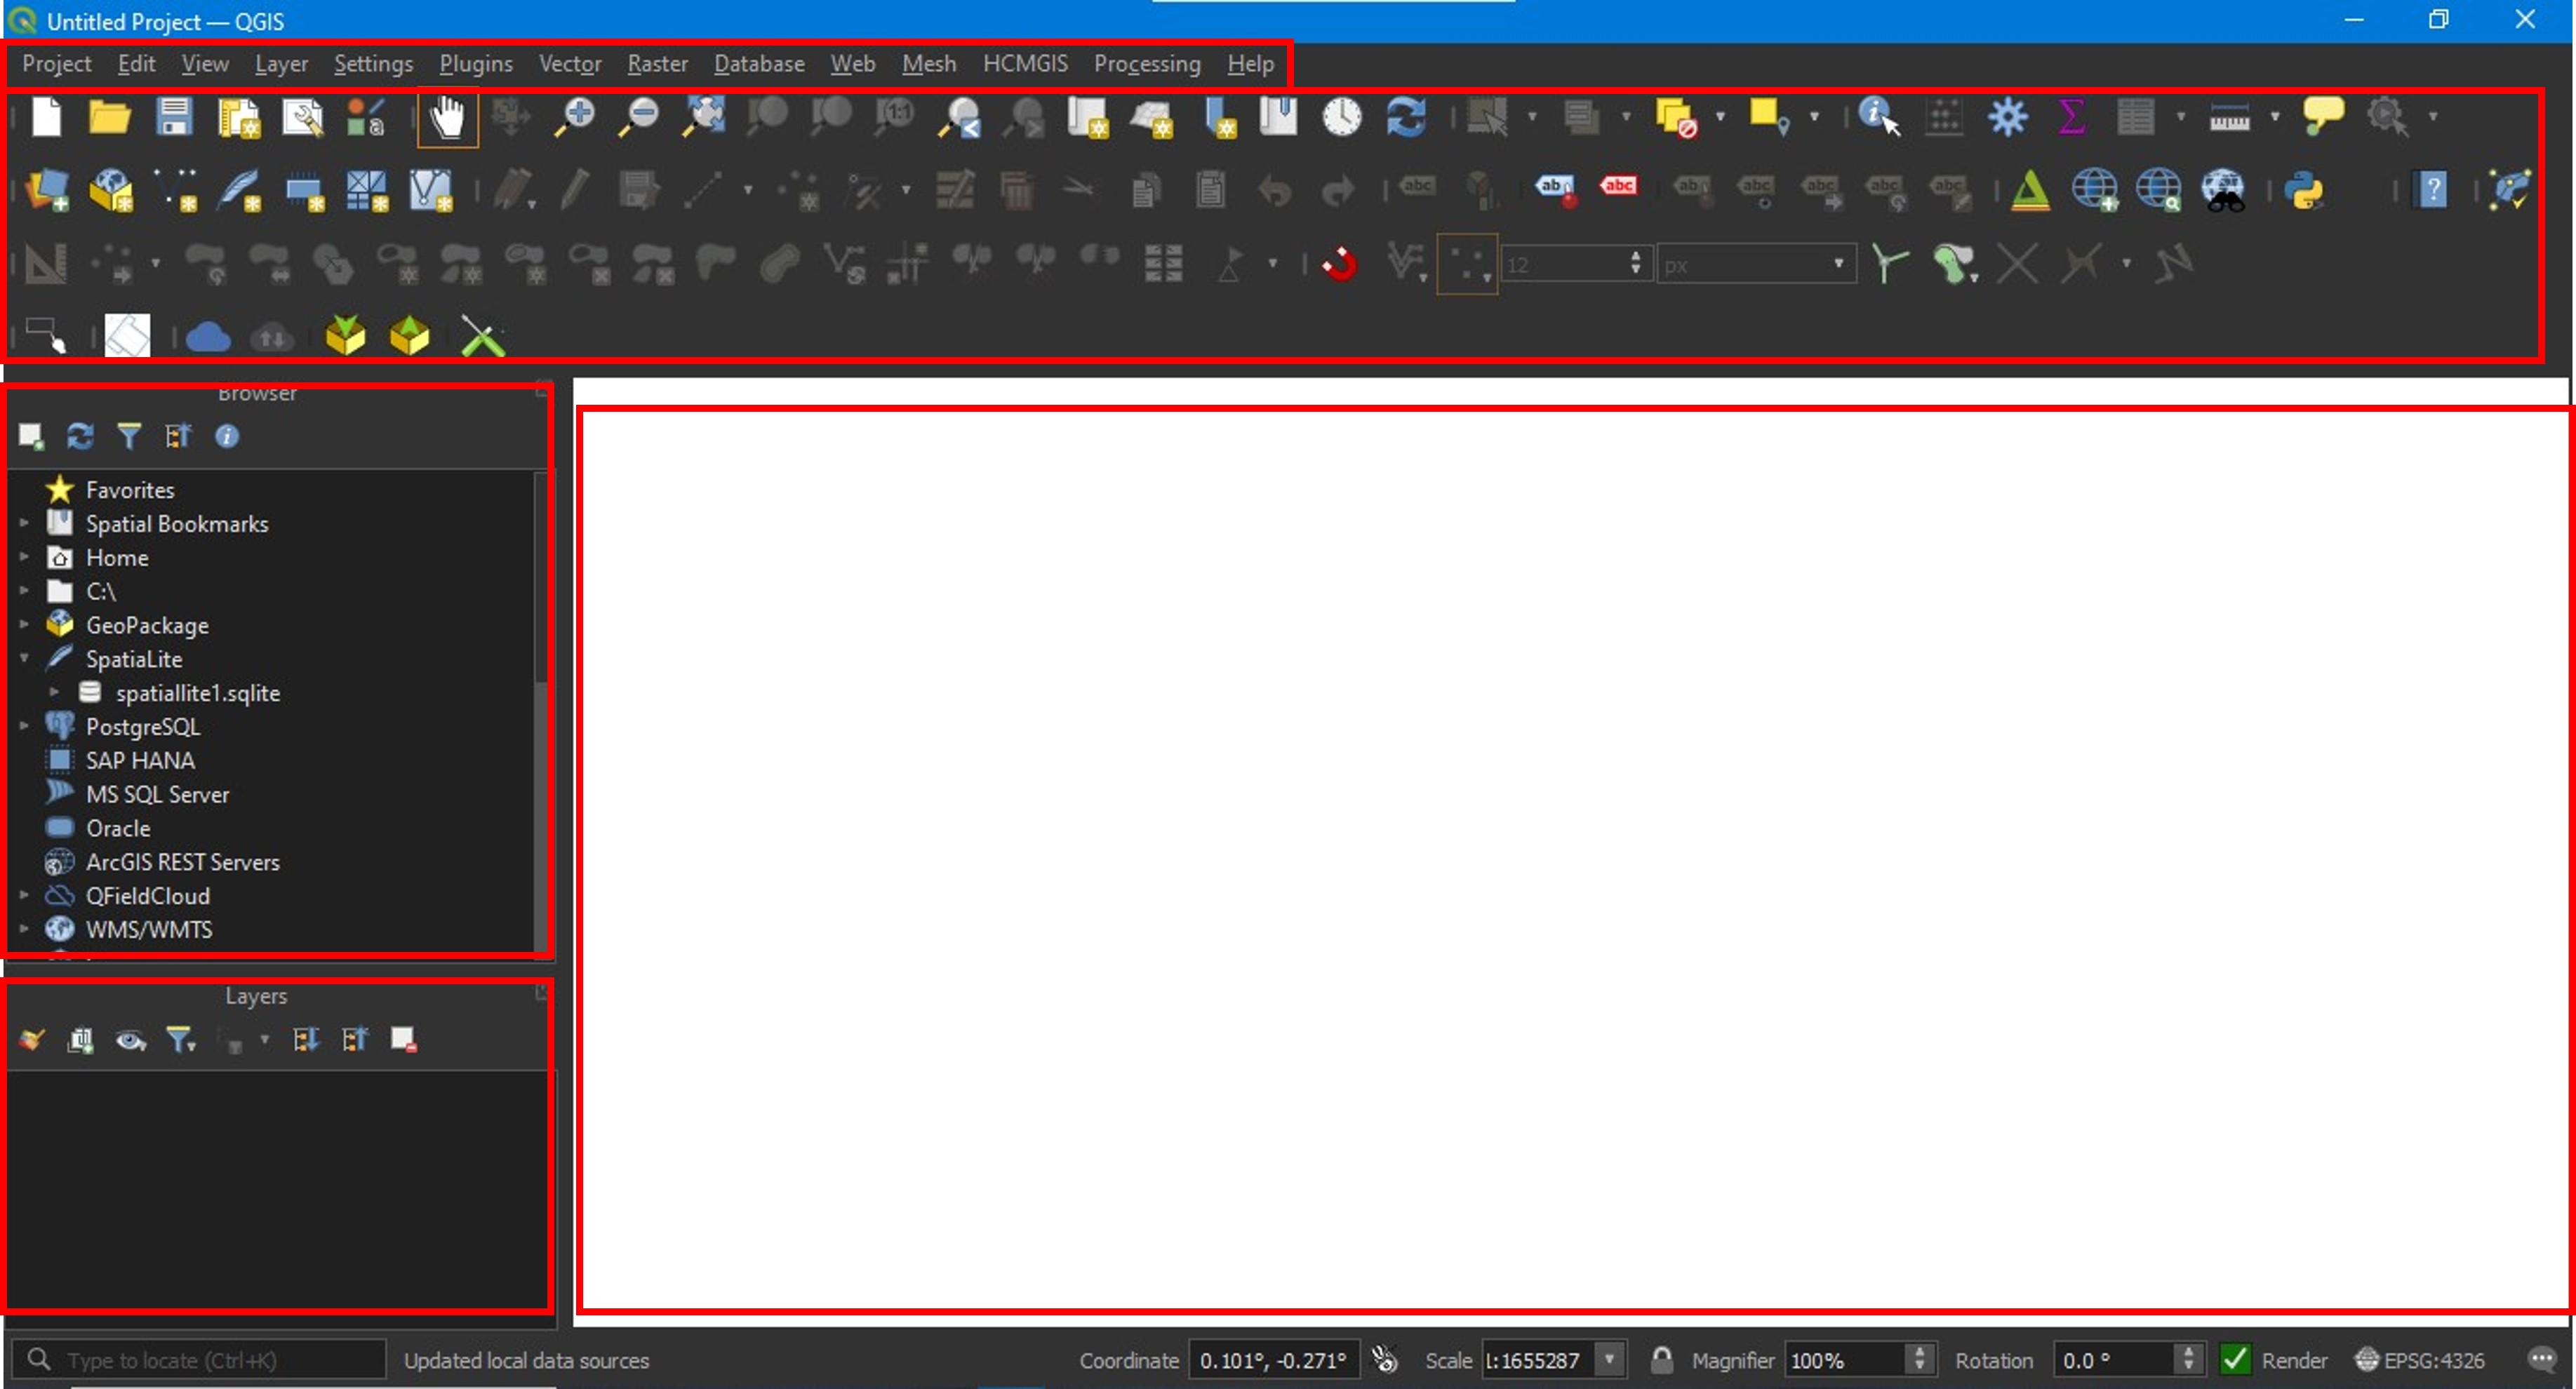
Main Components
Menu Bar - Located at the top, provides access to all QGIS functions organized by category (Project, Edit, View, Layer, Settings, etc.)
Toolbars - Customizable button panels for quick access to common tools. Key toolbars include: - Project toolbar - create, open, and save projects - Map Navigation - zoom, pan, and navigate your map - Attributes - identify features and open attribute tables - Digitizing - create and edit vector data
Map Canvas - The central area where your geographic data is displayed. This is your main workspace for visualizing and interacting with spatial data.
Panels - Dockable windows that provide specific functionality: - Browser Panel - navigate your file system and connect to data sources - Layers Panel - manage the drawing order and visibility of map layers - Processing Toolbox - access hundreds of geoprocessing algorithms
You can customize panel positions by dragging them, or hide/show panels through the View > Panels menu.
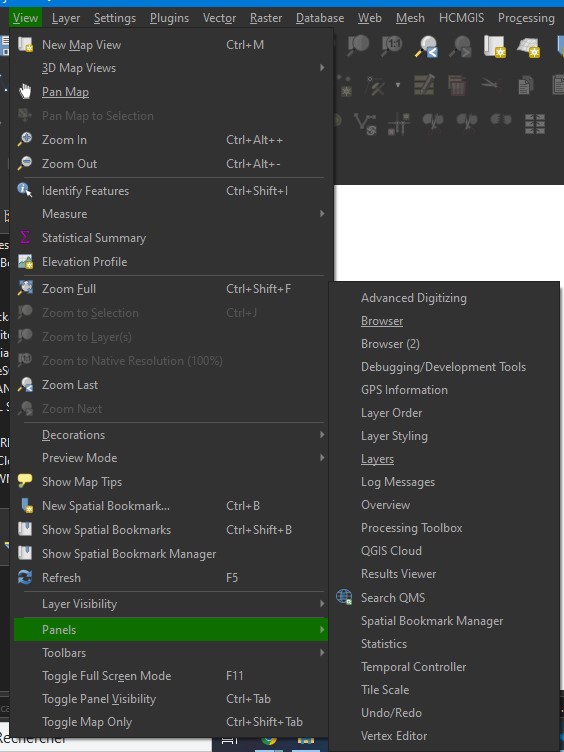
Customizing Your Workspace
QGIS allows extensive customization. Right-click on any toolbar to show/hide different toolbars. Arrange panels by dragging them to different screen edges or making them float.
Your First QGIS Project
Let’s create a simple project to get familiar with basic operations.
Step 1: Add a Basemap
Basemaps provide geographic context for your data. We’ll use OpenStreetMap as our basemap.
- Go to Layer > Add Layer > Add XYZ Layer
- In the Data Source Manager, expand XYZ Tiles
- Double-click OpenStreetMap to add it to your map canvas
You should now see a world map in your canvas! Use your mouse wheel to zoom in and out, and click-drag to pan around.
Pro tip: Install the QuickMapServices plugin for access to more basemap options like Google Satellite and Bing Maps.
Step 2: Load Vector Data
Vector data represents geographic features as points, lines, or polygons. Let’s add a sample shapefile.
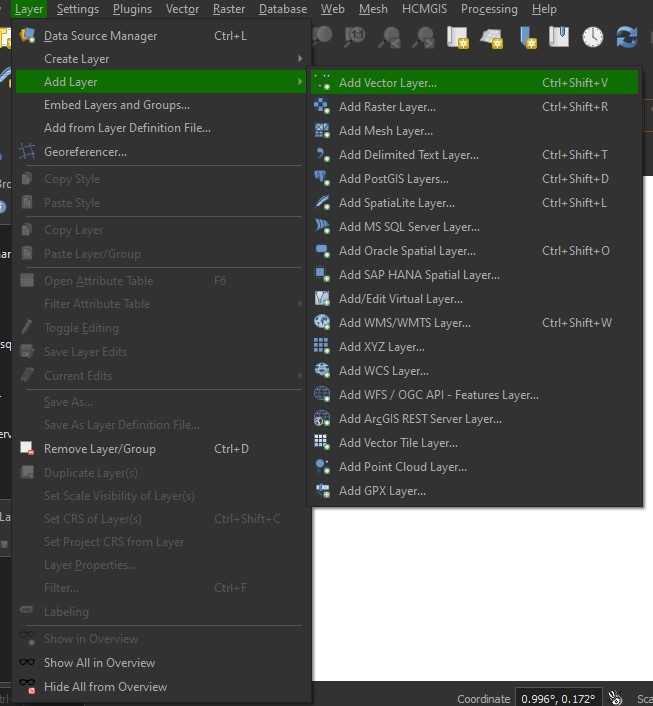
- Click the Open Data Source Manager button (or press
Ctrl+L) - Select Vector from the left sidebar
- Click the … button next to “Vector Dataset(s)”
- Navigate to your shapefile (
.shpfile) and click Open - Click Add to load the layer
Your vector data will appear on top of the basemap. Each layer appears in the Layers Panel on the left.
Common vector formats: - Shapefile (.shp) - traditional GIS format - GeoJSON (.geojson) - web-friendly format - GeoPackage (.gpkg) - modern, single-file format - KML/KMZ (.kml) - Google Earth format
Step 3: Basic Navigation
Master these essential navigation techniques:

- Zoom In/Out - mouse wheel or magnifying glass tools
- Pan - click and drag with the hand tool (spacebar shortcut)
- Zoom Full - click the globe icon to see all layers
- Zoom to Layer - right-click a layer and select “Zoom to Layer”
- Identify Features - use the info tool to click features and see their attributes
Keyboard shortcuts to remember: - Ctrl+F - Zoom full extent - Ctrl+Shift+F - Zoom to layer - Hold Space - Temporary pan mode - Ctrl+I - Identify features tool
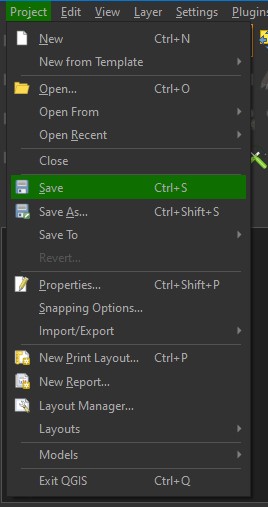
Step 4: Save Your Project
Always save your work! QGIS projects use the .qgz extension.
- Go to Project > Save As
- Choose a location and filename
- Click Save
The project file stores layer references, styling, and project settings - but not the actual data files. Keep your data files in accessible locations.
Layer Management Basics
Understanding how to work with layers is fundamental to GIS.
Layer Order and Visibility
Layers are drawn from bottom to top in the Layers Panel. Drag layers to reorder them - typically you want basemaps at the bottom and point data at the top.
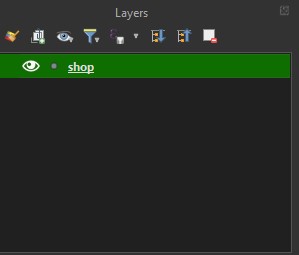
Toggle layer visibility by checking/unchecking the box next to each layer name. Use the eye icons to control visibility without removing layers from your project.
Layer Properties
Right-click any layer and select Properties to access extensive customization options:
- Symbology - change colors, symbols, and styling
- Labels - add text labels from attribute data
- Source - view data source information
- General - set layer name, coordinate system, and scale visibility
We’ll explore these options in depth in Part 2 of this tutorial series.
Essential Tips for Beginners
Coordinate Reference Systems (CRS): QGIS automatically handles different coordinate systems, but understanding CRS is important. Check your project CRS in the bottom-right corner. Click it to change the project’s display CRS.
Attribute Tables: Right-click any vector layer and select Open Attribute Table to see the data behind the geometry. Each row represents a geographic feature.
Processing Toolbox: Access hundreds of geoprocessing tools through Processing > Toolbox. Use the search bar to find specific tools quickly.
Plugins: Extend QGIS functionality through plugins. Go to Plugins > Manage and Install Plugins to browse thousands of available extensions.
Documentation: The official QGIS documentation at docs.qgis.org is comprehensive and regularly updated. Use it whenever you’re stuck.
What’s Next?
Congratulations! You’ve successfully installed QGIS, explored the interface, and created your first map project. You now have the foundation to begin working with geospatial data.
In Part 2 of this tutorial series, we’ll cover: - Working with attribute data and making selections - Styling layers and creating professional cartography - Basic spatial analysis operations - Exporting maps and creating print layouts
Practice Exercise
Before moving to Part 2, try this exercise:
- Download some free geographic data from Natural Earth (naturalearthdata.com)
- Load multiple layers into a new QGIS project
- Add a basemap and arrange layers in logical order
- Zoom to different areas and explore the data
- Save your project with a descriptive name
The more you practice with the interface, the more comfortable you’ll become with QGIS workflows.
Additional Resources
- QGIS Official Website: qgis.org
- QGIS Documentation: docs.qgis.org
- QGIS Tutorials: qgistutorials.com
- GIS Stack Exchange: gis.stackexchange.com (community Q&A)
- Natural Earth Data: naturalearthdata.com (free vector and raster data)
Happy mapping, and see you in Part 2!
📧 Contact & Collaboration
Have questions about this analysis or interested in collaborating on geospatial projects? We’d love to hear from you!
Get in touch with our research team: - Email: mapcrafty@gmail.com - Subject line: “Inquiry about Remote Sensing Applications for urban growth Monitoring”
Whether you’re working on similar research, need technical consultation, or want to discuss potential collaborations in geospatial analysis, don’t hesitate to reach out. Our team is always excited to connect with fellow researchers and practitioners in the GIS and remote sensing community.
We typically respond within 24-48 hours and welcome discussions about methodology, data sources, and potential research partnerships.