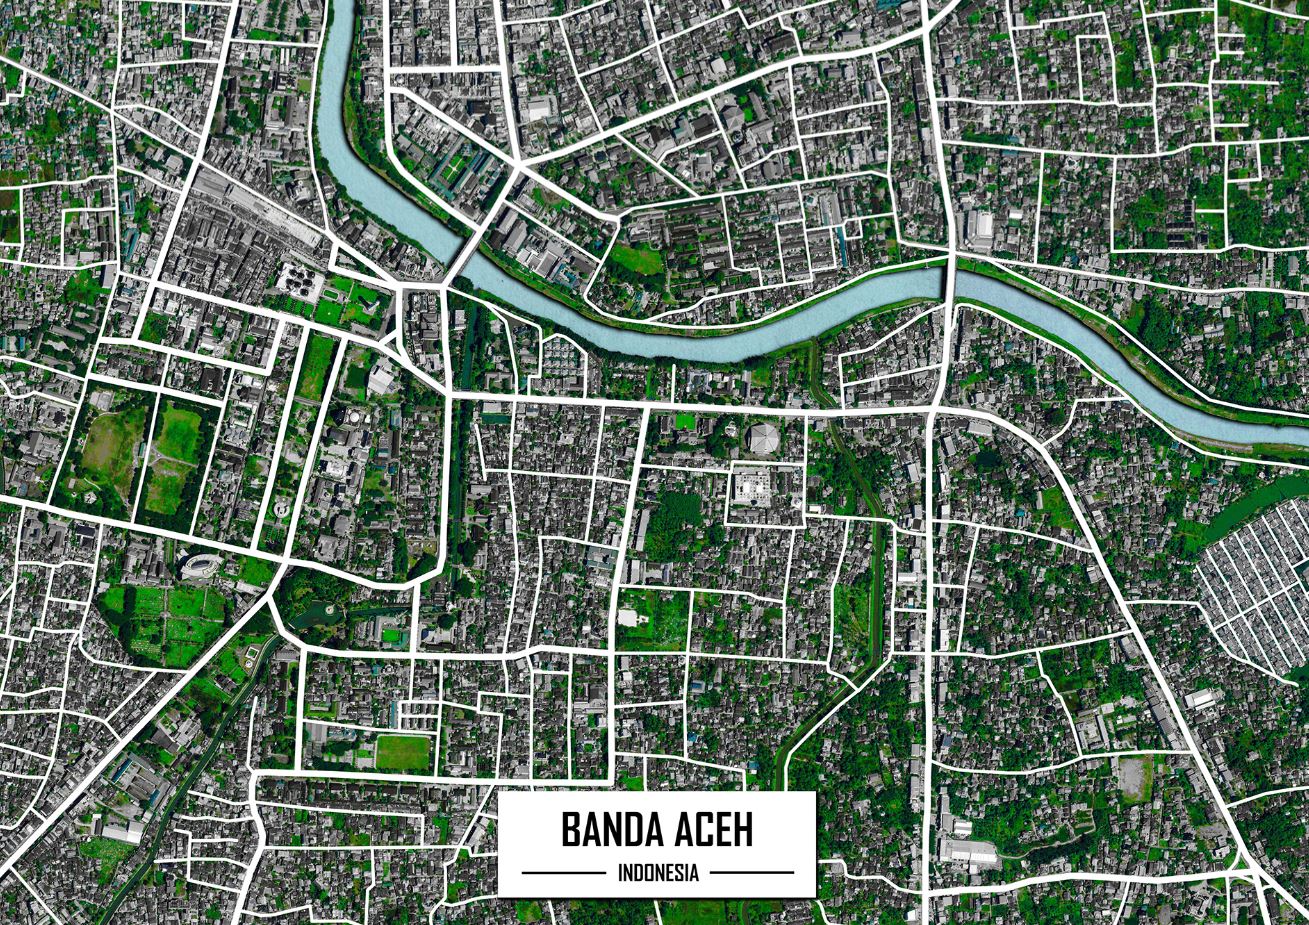
Mapping Urban Heat Islands with GIS

Urban Heat Islands (UHIs) represent one of the most significant climate challenges facing modern cities. These phenomena occur when urban areas experience significantly higher temperatures than surrounding rural regions, often by 1-7°C during nighttime hours.
The GIS Advantage
Geographic Information Systems have revolutionized our understanding of UHIs by enabling precise spatial analysis and visualization. Remote sensing data from satellites like Landsat and MODIS provide thermal infrared imagery that reveals surface temperature patterns across entire metropolitan areas.
GIS analysts use Land Surface Temperature (LST) algorithms to process satellite imagery, creating detailed heat maps that identify hotspots and cool zones within cities. These maps reveal how different land uses affect local temperatures - asphalt parking lots and dense concrete areas typically show as red zones, while parks and water bodies appear as cooling blue areas.
Practical Applications
Urban planners leverage GIS-generated heat maps to make informed decisions about: - Green infrastructure placement to maximize cooling effects - Building material selection in high-temperature zones
- Public health resource allocation during heat waves - Zoning regulations that promote temperature-reducing development
Technology Integration
Modern GIS platforms integrate multiple data sources including weather station readings, building heights from LiDAR, vegetation indices from multispectral imagery, and population density data. This comprehensive approach enables cities like Barcelona and Singapore to develop targeted cooling strategies.
Machine learning algorithms within GIS environments can now predict future heat island formation based on proposed development patterns, making GIS an essential tool for climate-resilient urban planning.
The intersection of GIS technology and urban climatology continues advancing our ability to create cooler, more livable cities.